Search results
Search for "transmission spectra" in Full Text gives 47 result(s) in Beilstein Journal of Nanotechnology.
Investigations on the optical forces from three mainstream optical resonances in all-dielectric nanostructure arrays
Beilstein J. Nanotechnol. 2023, 14, 674–682, doi:10.3762/bjnano.14.53

- force is dependent on the laser power, we should note that the light transmission spectra through the array is not if the nonlinear effect is ignored. So in the calculations of the transmission spectra and the on-resonance field distributions, the electric field magnitude of the incident plane wave is


Quasi-guided modes resulting from the band folding effect in a photonic crystal slab for enhanced interactions of matters with free-space radiations
Beilstein J. Nanotechnol. 2023, 14, 322–328, doi:10.3762/bjnano.14.27

- , the Q-factor decreases for larger wave numbers but maintains overall large values (above 103) for all resonances. To have a moderate level of Q-factors (i.e., measurable in practical experiments) for the transmission spectra presented in the subsequent part, we used intentionally a stronger
- number in a direction different from the direction of lattice change. To have a straightforward demonstration of tuning the resonance via the incident angle, we present in Figure 4 the calculated transmission spectra for three different incident angles of 3°, 6°, and 9° along both x and y directions. We
- and ky direction, respectively. (a) Q-factors along the dispersion curves of QGMs in Figure 2. (b) Q-factor as a function of the level of perturbation at two points along two directions. Transmission spectra at different incident angles with the incidence in (a) the xz plane and (b) the yz plane. (c


Modeling a multiple-chain emeraldine gas sensor for NH3 and NO2 detection
Beilstein J. Nanotechnol. 2022, 13, 721–729, doi:10.3762/bjnano.13.64

- the transmission spectrum was carried out. Transmission spectra were used to obtain relevant I–V characteristics. There were only one or two molecule chains in the calculations and only several ammonia or nitrogen dioxide molecules are affecting the PANI molecules. Therefore, the quantity of free


Tunable high-quality-factor absorption in a graphene monolayer based on quasi-bound states in the continuum
Beilstein J. Nanotechnol. 2022, 13, 675–681, doi:10.3762/bjnano.13.59

- ) are obtained from reflection spectra R(λ) and transmission spectra T(λ) through A(λ) = 1 − R(λ) − T(λ), where, R(λ) and T(λ) are calculated by employing the rigorous coupled wave analysis (RCWA) method [57][58]. Clearly, a sharp strong resonant absorption peak is observed at a wavelength of 7908.03 nm
- the graphene monolayer when it is attached on the grating. The enhanced absorption in the graphene monolayer is attributed to the excitation of optical quasi-BICs of radiation modes. To confirm that the absorption originates from quasi-BICs, we show the simulated zero-order transmission spectra of the
- -order transmission spectra of the structures without graphene monolayer for angles of 0°, 0.1°, 0.5°, 1.0°, 1.5°, and 2.0°; (b) dependence of the Q-factor on the inverse square of the asymmetric parameter β−2 (log–log scale). Polar plot of the absorption at wavelengths of λ1 = 7908.03 nm and λ2 = 7444.8


Reliable fabrication of transparent conducting films by cascade centrifugation and Langmuir–Blodgett deposition of electrochemically exfoliated graphene
Beilstein J. Nanotechnol. 2022, 13, 666–674, doi:10.3762/bjnano.13.58

- of the other three films, as SEM operation quickly leads to surface charging effects. Optoelectronic properties UV–vis spectra of the deposited graphene films at different centrifugation rates, redispersed in specified volumes of NMP, are given in Figure 5. The optical transmission spectra are


Selected properties of AlxZnyO thin films prepared by reactive pulsed magnetron sputtering using a two-element Zn/Al target
Beilstein J. Nanotechnol. 2022, 13, 344–354, doi:10.3762/bjnano.13.29

- -needle distance of 1.00 mm. The measurement was carried out such that the line connecting the four needles was perpendicular to the longest dimension (350 mm) of the glass stripe. The optical properties were evaluated on the basis of the transmission spectra. The characteristics were acquired using an


Low-energy electron interaction and focused electron beam-induced deposition of molybdenum hexacarbonyl (Mo(CO)6)
Beilstein J. Nanotechnol. 2022, 13, 182–191, doi:10.3762/bjnano.13.13

- ]− is in the current study and in the study by Pignataro and co-workers [20], observed at an energy of 0.4 eV and not at 2.2 eV as by Winters and Kiser [19]. Resonant electron capture at threshold is clear in the electron transmission spectra from Giordan et al. [18] indicating that in the study by
- are closer to 20:1 in the current study. This implies that [Mo(CO)5]− observed at 2.2 eV by Winters and Kiser, is from the high-energy tail of the threshold resonances or from the 1.65 eV resonance observed in the transmission spectra reported by Giordan and co-workers [18]. For the loss of two CO


Structural and optical characteristics determined by the sputtering deposition conditions of oxide thin films
Beilstein J. Nanotechnol. 2021, 12, 354–365, doi:10.3762/bjnano.12.29

- thickness. The optical constants (i.e., the refractive index n, the extinction coefficient k, and the absorption coefficient α) of the SiO2 and ZnO oxide films were determined from the transmission spectra recorded in the range of 190–2500 nm by using the Swanepoel method, while the energy bandgap was
- +90°. Therefore, the dynamic focusing with tilt angle was successfully used. The thickness was measured by the cross-section technique of the SEM analysis, with a margin of error of ±5% (2–5 nm) compared to a standard 100 nm thick sample. Optical transmission spectra were acquired using a UV–vis–NIR
- thickness values, and the determination of the optical constants are useful for their integration into the design and construction of metamaterial structures. The optical properties of the films were characterized based on the transmission spectra (Figure 8) and the Swanepoel model was chosen to determine


Absorption and photoconductivity spectra of amorphous multilayer structures
Beilstein J. Nanotechnol. 2020, 11, 1757–1763, doi:10.3762/bjnano.11.158

- ; photocurrent; transmission spectra; Introduction The As–S–Se, Ge–As–Se, and Ge–As–S ternary glass systems currently attract a lot of attention because of their wide application in IR optics, non-linear optics, photonics, optoelectronics, and as recording media for holography and e-beam lithography [1][2][3
- using a spectrophotometer SPM-2 and an electrometrical amplifier U1-7, with a measurement error below ±1.0%. All experiments were performed at room temperature (T ≈ 20 °C). Results and Discussion Figure 1 shows the transmission spectra T = f(λ) of the separate amorphous thin films Ge0.30As0.04S0.66 (1
- polarity for all investigated amorphous thin-film structures. This result can be explained by drift processes of non-equilibrium carriers in amorphous semiconductors as well as by the contact phenomena between interfaces of different amorphous materials and the metallic electrodes. Transmission spectra T


Highly sensitive detection of estradiol by a SERS sensor based on TiO2 covered with gold nanoparticles
Beilstein J. Nanotechnol. 2020, 11, 1026–1035, doi:10.3762/bjnano.11.87

- µM, 100 µM, and 1 mM. Samples were left in the E2 solutions for 1 h before being rinsed with RO water and blown dry. Figure 1 gives a schematic of the final system. Optical and SERS measurements Plasmon resonance was evaluated via optical spectroscopy. For this purpose, transmission spectra were
- ), 6 nm (c), and 15 nm (e) of Au, and of TiO2 12 Pa with 3 nm (b), 6 nm (d), and 15 nm (f) of Au. All micrographs were acquired after annealing. Optical transmission spectra of TiO2/Au 8 Pa (a) and 12 Pa (b) samples before and after annealing. SERS measurements. The red, green and blue lines show SERS
- the empty sensor and its uncertainty. Average equivalent diameter with standard deviation of Au NPs on TiO2 films after annealing. LSPR wavelength (minima of transmission spectra) and corresponding FWHM. Enhancement factor values for MBA, calculated for the peaks at 1080 and 1590 cm−1. Funding The


Gold and silver dichroic nanocomposite in the quest for 3D printing the Lycurgus cup
Beilstein J. Nanotechnol. 2020, 11, 16–23, doi:10.3762/bjnano.11.2

- flashlight LED. The reflectance spectra of the 3D printed AgNP@PVA reflect this discrepancy in the illumination system, showing a greener colour when illuminated by the flashlight LED and a red-shifted spectrum when illuminated by the CRI 95 LED. The transmission spectra are more similar for the two


Plasmonic nanosensor based on multiple independently tunable Fano resonances
Beilstein J. Nanotechnol. 2019, 10, 2527–2537, doi:10.3762/bjnano.10.243

- concise description, each time only one parameter has a variation, the other parameters are held constant. Figure 4a shows the transmission spectra of changing the distance d between two stubs. It was found that the resonance wavelength of peak1 will produce a significant red shift by increasing d, while
- in some specific situations. Next, the influence of adjusting the parameters of cavity1 on the transmission spectra are discussed in detail. Firstly, the influence of the height of cavity1 h on the transmission spectrum is studied and the results are shown in Figure 5a. It can be seen that peak2 and
- by the right and bottom parts of cavity1. This kind of multiple use of the cavity can effectively decrease the size of the structure. Subsequently, we investigated the features of cavity2 and cavity3 on sensing performance. Figure 6a shows the relation between r1 and the transmission spectra. When


Multiple Fano resonances with flexible tunablity based on symmetry-breaking resonators
Beilstein J. Nanotechnol. 2019, 10, 2459–2467, doi:10.3762/bjnano.10.236

- angle is ϕ = 0° and the deviation distance is d = 0. Figure 2 shows the transmission spectra of the designed waveguide–resonator coupled system. Different values of the thickness of the metal wall, t, were studied. When a metal wall is placed in a MDM waveguide, the transmittance is low over a wide
- the Fano resonance is investigated. The evolution of the transmission spectra as a function of the inner radius is given in Figure 3a. The transmission peaks move to longer wavelengths with the increase of r. The inset shows the resonance wavelength λ0 as a function of r. The resonance wavelength is
- symmetry-breaking on the Fano resonance. The symmetry-breaking is introduced by deviating center points O and O′. When the deviation distance d is greater than 0, a regular ring becomes an off-centered ring. Figure 5a displays the transmission spectra at d = 80 nm with varying angle ϕ. When ϕ is rotated


Giant magnetoresistance ratio in a current-perpendicular-to-plane spin valve based on an inverse Heusler alloy Ti2NiAl
Beilstein J. Nanotechnol. 2019, 10, 1658–1665, doi:10.3762/bjnano.10.161

- similar intensity of transport ability, while the transport ability of the spin up electrons of the TiAlT terminated structure suffers from deterioration. Now, the situation when the device is in the APC state will be discussed. It can be seen that in the APC state, the transmission spectra of the spin up


Rapid thermal annealing for high-quality ITO thin films deposited by radio-frequency magnetron sputtering
Beilstein J. Nanotechnol. 2019, 10, 1511–1522, doi:10.3762/bjnano.10.149

- ) with Cu Kα radiation (λ = 1.5418 Å) at a power of 40 kV/40 mA. The scan was performed between 20° and 60° with a 2 s/step scan speed and 0.04° step. Optical transmission spectra of the deposited thin films were measured with a UV–vis–NIR Perkin Elmer 950 spectrophotometer (190–3300 nm). The electrical
- transitions, we plotted and studied the transmission spectra of the ITO thin films (Figure 5). These polycrystalline thin films show considerable promise for integration into photovoltaic structures, having the bandgap width close to the optimum value of 3.7 eV [39]. Following the RTA process, the ITO thin
- oxide films (Figure 5) was described by the free electron model. Thus, an algorithm using computational models and the optical properties for oxide films (Swanepoel and Wemple–DiDomenico models [44]) was developed. The presence of interference maxima and minima in the transmission spectra of ITO thin


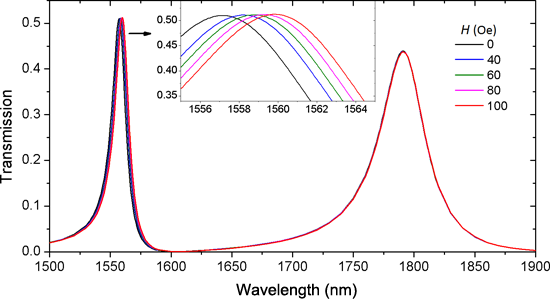
Magnetic-field sensor with self-reference characteristic based on a magnetic fluid and independent plasmonic dual resonances
Beilstein J. Nanotechnol. 2019, 10, 247–255, doi:10.3762/bjnano.10.23
- investigate the spectral response. In the simulations, we fix W = 50 nm and g = 10 nm. The radius of the disk is R = 280 nm. The widths of stubs are W1 = 100 nm, and W2 = 100 nm. The lengths of the stubs are L1 = 180 nm, and L2 = 280 nm. The obtained transmission spectra for different resonator-coupled
- increases from 1.4623 to 1.464 when the magnetic field H increases from 40 to 100 Oe. Figure 5 shows the transmission spectra as a function of the external magnetic field H. The left resonance at lower wavelengths is more influenced by the magnetic field strength than the right resonance at higher
- . The width of the waveguide is W and the radius of the disk is R. L1, L2, and W1, W2 denote the length and the width of two stubs, respectively. The coupling distance between the disk resonator and the upper stub is g. Transmission spectra for different resonator-coupled structures. The radius of the


Nanoantenna structures for the detection of phonons in nanocrystals
Beilstein J. Nanotechnol. 2018, 9, 2646–2656, doi:10.3762/bjnano.9.246

- microantenna arrays were carried out in the spectral range of 30–5000 cm−1 using a Bruker Vertex 80v Fourier transform spectrometer. The IR spectra were recorded for different angles of incidence (from 0 to 55°) and polarizations (TE and TM). For further evaluation, the ratio of the IR transmission spectra
- shown in Figure 1. The length and transverse period of the nanoantennas in different arrays were changed, while the nanoantenna width and the inter-antenna gap were fixed to be about 100 nm. In Figure 2a and 2b, the IR transmission spectra of the linear nanoantenna arrays fabricated with different
- formed near the gaps of linear and H-shaped nanoantennas where the maximal field enhancement for the light polarization along the nanoantennas is expected. The IR transmission spectra of the samples with linear nanoantenna arrays before and after deposition of CdSe and CdS NCs with different ML quantities


Two-dimensional photonic crystals increasing vertical light emission from Si nanocrystal-rich thin layers
Beilstein J. Nanotechnol. 2018, 9, 2287–2296, doi:10.3762/bjnano.9.213

- carefully fitting the Fabry–Perot resonances in the transmission spectra. The distribution of refractive index naturally follows the spatial distribution of SiNCs and therefore it can be approximated by an asymmetric Gaussian function. The spatial profile of the refractive index is schematically depicted by


Dumbbell gold nanoparticle dimer antennas with advanced optical properties
Beilstein J. Nanotechnol. 2018, 9, 2188–2197, doi:10.3762/bjnano.9.205

- optical properties of individual CB[8]-mediated dumbbell dimers. (A) Scattering spectrum of a 40–80 nm AuNP dimer with a gap size of 1.0 nm calculated within the dipolar approximation limit. (B–H) Dark-field transmission spectra of individual dimers assembled in solution and deposited on a carbon-coated


Cathodoluminescence as a probe of the optical properties of resonant apertures in a metallic film
Beilstein J. Nanotechnol. 2018, 9, 1491–1500, doi:10.3762/bjnano.9.140

- wavelength maximum in the transmission spectra, we see a spatial dependence of emission with strong enhancement near the edges of the apertures consistent with the excitation of cavity modes. At a wavelength of 860 nm (Figure 6d) we see strong emission over the central region suggesting that the excitation


Enzymatically promoted release of organic molecules linked to magnetic nanoparticles
Beilstein J. Nanotechnol. 2018, 9, 986–999, doi:10.3762/bjnano.9.92

- ) Fluorescence spectra of 6 (black curve) and 9 (red curve). B) Fluorescence spectra of 12 (black curve) and 13 (blue curve). A) Infrared transmission spectra of 9 compared with nonconjugated 6 and with NP@APTES and magnetite; B) infrared transmission spectra of 13 compared with nonconjugated 12. Room


High-contrast and reversible scattering switching via hybrid metal-dielectric metasurfaces
Beilstein J. Nanotechnol. 2018, 9, 460–467, doi:10.3762/bjnano.9.44

- . Therefore, as can be seen, all these components, separately, exhibit a sharp resonance at the target wavelength. Figure 2c and 2d show the transmission spectra of the hybrid metasurfaces with one gold bar and two gold bars, respectively. As it has been recently demonstrated, heating the system causes a
- responses in the metasurface can be reflected from the transmission spectra shown in Figure 2c, where the transmission is suppressed in this range (black curve). After heating, the scattering properties can be tuned drastically and a significant Fano-like resonance appears. The corresponding multipoles


Temperature-tunable lasing from dye-doped chiral microdroplets encapsulated in a thin polymeric film
Beilstein J. Nanotechnol. 2018, 9, 379–383, doi:10.3762/bjnano.9.37

- deposited by spin-coating a solution containing 0.5 wt % of the polymer in water. An optical fiber, coupled to a spectrometer (AVASPEC-2048, Avantes) with 1 nm resolution, is used to collect the light emitted from the sample. To detect the transmission spectra as a function of temperature, the cell is


Design of polar self-assembling lactic acid derivatives possessing submicrometre helical pitch
Beilstein J. Nanotechnol. 2018, 9, 333–341, doi:10.3762/bjnano.9.33

- [61]. The p(T) characteristics were calculated from the equation p = λS/nav for SmCA* and p = λS/2nav for SmC* (the value nav = 1.5 was estimated according to [56][62]) using data acquired for samples observed at normal incidence. The transmission spectra were acquired using a Shimadzu UV–VIS–NIR


Growth model and structure evolution of Ag layers deposited on Ge films
Beilstein J. Nanotechnol. 2018, 9, 66–76, doi:10.3762/bjnano.9.9

- evolution of the film structure. If stored under ambient conditions for the first week after deposition, the changes in the transmission spectra are smaller than the measurement accuracy. Over the course of the following three weeks, the segregation-induced effects result in considerably modified
- transmission spectra. Two months after deposition, the slope of the silver layer density profile derived from the XRR spectra was found to be inverted due to the completed segregation process, and the optical transmission spectra increased uniformly due to the roughened surfaces, corrosion of silver and
- function of the Ge-to-Ag thickness ratio. To this end, we have deposited silver on germanium with a fixed total thickness of both films equal to 20 nm, but with changing Ge-to-Ag ratio from 1:7 to 1:1, and recorded the transmission spectra of those samples over a period of 7 weeks. Time evolution of these


